Accurately identify lower-performing areas of crops and implement informed mitigation strategies with your yield data.
Chances are, your precision ag equipment already has built-in yield mapping technology. But are you making the most of that data?
Australian agriculture is at the forefront of farming innovation, yet I still see many growers opting to turn a blind eye to the data their technology provides.
With all the challenges of farming only seeming to heighten, this ‘out of sight, out of mind’ mindset may be severely limiting your farm’s profit. A quick glance at the real-time yield data on your displays during harvest isn’t enough to make informed decisions. Farmers need to be extrapolating this information into yield maps in order to make data-driven decisions that improve operational efficiency year-on-year.
So, let’s go over what is yield mapping, how to understand your field data, and why you need it.
What is Yield Monitoring?
Introduced in the early 1990s, yield mapping is the process of collecting geo-referenced data on crop yield and yield variability, including characteristics like moisture content, in a field.
To measure this data, harvesters use a range of sensors and systems such as:
- Flow sensors to determine the quantity of crop being harvested as the harvester moves across the field in real-time.
- Ground speed sensors are used to measure the speed of the harvester for accurate results. This is ideally measured using GPS, but can also be collected via a ground speed sensor that measures speed from the wheel rotation.
- GPS receivers for geo-coding the measurement made by other sensors. A GPS receiver is fitted on the combine which constantly gives locations to each measurement taken.
- Yield-monitor displays fitted inside the cab to provide real-time yield data during harvest via standard Trimble displays.
What is waterlogging?
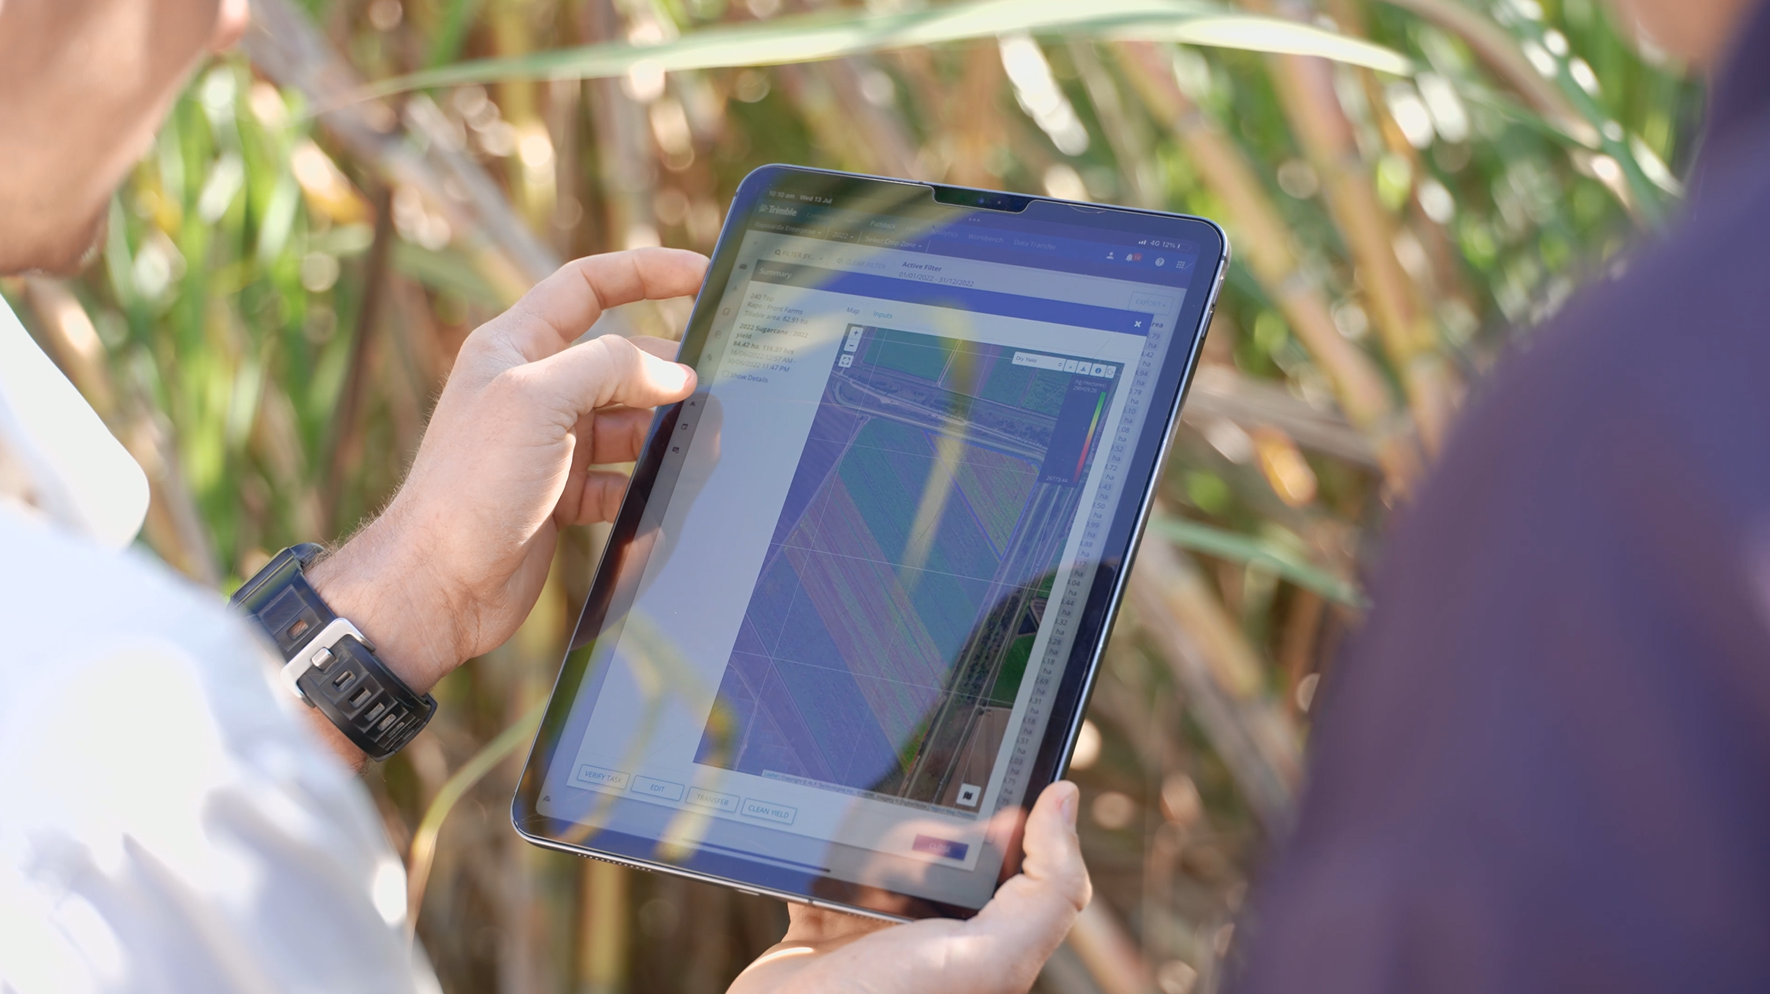
The data collected during harvest is then classified on specific zones, fields, or ranges using different colours to produce a range map or a zone-classified map.
Yield maps make it easier for farmers to visualise their data, particularly when comparing data across multiple harvests.
Why Do Farmers Need Yield Monitoring & Mapping?
With yield monitoring, farmers can map and compare the performance of different varieties in their fields, identify lower-performing areas and track yield metrics in real-time for comparative analysis year-on-year.
Yield monitoring can help guide decisions on:
- Planting (zoning) and crop rotation
- Seed selection and genetic potential
- Soil tillage and fertilisation
- Water and nutrient availability and absorption
- Presence of weeds and pests
- Harvest planning, delivery estimates, and storage requirements
- Cash flow and profit mapping
Yield monitoring also allows farmers to test new methods, technology, and systems to see which works best, year after year. It can also provide field records, often critical in difficult times for crop insurance and financial documentation purposes.
Yield Monitoring with Vantage BMS
As Australia’s largest Trimble Agriculture dealer, we supply Trimble precision ag solutions enabling farmers to better understand their yield data, including Trimble’s Farmer Pro software. Farmer Pro is an industry-leading farm management software solution that manages field record keeping, real-time fleet tracking, field data and profit analysis, soil sampling, and more. Learn more
Vantage BMS has also developed a custom Sugarcane Yield Monitoring System which utilises various sensors mounted on the cane harvesters and works in conjunction with the Trimble TMX-2050™ display system to show real-time yield data when harvesting. Learn more
Our yield monitoring data processing services include data cleaning and calibration to produce high-quality yield maps. Trimble Agriculture’s automated yield cleaning tool takes the raw yield data from your harvester to resolve yield issues such as grain flow delay, pass delays, overlap and underlap. The software collaborates with different harvesters, allowing the machines to ‘talk’ to each other so you can see the areas within your fields’ performance and productively.
At Vantage BMS, we also include a yield shape file as part of our yield mapping service, providing farmers and contractors with a fully geo-referenced electronic yield map for immediate use. Our team can talk you through what your yield maps mean and advise you on your next course of action.
Ready to identify lower-performing areas and implement informed mitigation strategies with yield data? Chat with the Vantage BMS team.